Upgrade from Dashboards Classic to Dashboards
If you have classic dashboards created in the previous Dynatrace, you can automatically recreate them in the Dashboards app in the latest Dynatrace.
Why upgrade?
Upgrade your existing dashboards to the new Dashboards app to
- Experience a drastically faster and simpler user experience with the latest user interface
- Fetch all Dynatrace data from one place with Grail
- Blend in external data with app function-based code tiles
- Add more flexible and versatile filtering with variables
- Take context seamlessly with you with intents
Use this upgrade procedure and try your dashboards with the enhanced functionality of the new Dashboards app.
What’s in the scope of this upgrade?
When you upgrade a dashboard
- Dynatrace recreates your Dashboards Classic dashboard (with some exceptions as noted below) in the Dashboards app running under the latest Dynatrace.
You can continue to use the original dashboard in Dashboards Classic. This upgrade does not delete or change the original dashboard.
The upgrade mechanism supports a limited set of tile types from Dashboards Classic for recreation in the new Dashboards app. Supported tile types are:
All Data Explorer tiles (custom tiles that you created in Data Explorer)
All visualizations except Honeycomb and Heatmap (see below for details)
Markdown tiles and headers
What's not currently in the scope of this upgrade?
-
Built-in tiles (other than Markdown and Header tiles)
In the new dashboard (in the Dashboards app), Dynatrace replaces the built-in tile with a Markdown tile explaining that the built-in tile type can't be converted automatically and that you need to recreate it manually in the Dashboards app.
Image
Host health
Network metrics
Network status
Docker
VMware
AWS
Service health
Service or request
Top web applications
Application health
User behavior
User breakdown
World map
Key user action overview
Bounce rate
Top conversion goals
Conversion goal
JavaScript errors
Resources
Most used 3rd parties
Mobile app
Custom application
Live user activity
Web application
Key user action
User Sessions Query
Service-level objective
Browser monitor
Synthetic monitor health
Third-party monitor
HTTP monitor
Database health
Database performance
Data center service health
Problems
Smartscape
Log query table
-
Honeycomb and Heatmap visualizations
These visualization types are not yet supported in the Dynatrace app. Any tiles using these visualizations in the original dashboard are upgraded (added to the new dashboard) but with an automatically selected default visualization. You can change the visualization to another supported visualization type after the upgrade.
How to upgrade
You can upgrade a dashboard from the Dashboards page or from within the displayed dashboard.
After you upgrade a dashboard
The Dashboards app opens with the new dashboard displayed.
The original dashboard remains unchanged.
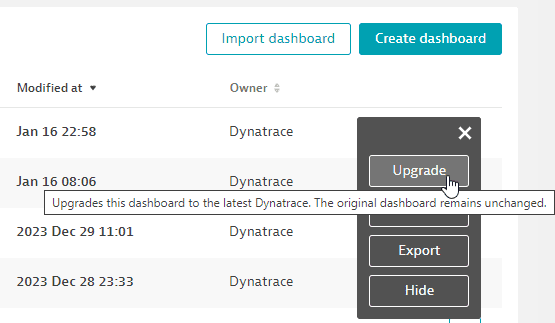
From the Dashboards page
To upgrade a dashboard from the Dashboards page
-
Go to Dashboards Classic in the latest Dynatrace.
-
On the Dashboards page, find a classic dashboard that you want to upgrade.
-
In that dashboard's row, select > Upgrade.
-
After the upgrade is completed, the recreated dashboard is displayed in the Dashboards app.
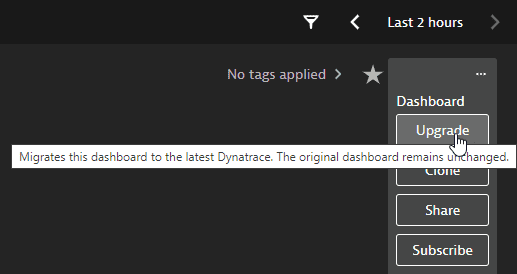
From the currently displayed dashboard
To upgrade a dashboard from within the displayed dashboard
-
Go to Dashboards Classic in the latest Dynatrace.
-
On the Dashboards page, find the dashboard that you want to upgrade and select its name to display that classic dashboard.
-
In the upper-right corner of the dashboard, select > Upgrade.
-
After the upgrade is completed, the recreated dashboard is displayed in the Dashboards app.
What to do after the upgrade
In the Dashboards app, review the new dashboard.
You can open the original and new dashboards in two different browser windows to compare them side by side, one with the old dashboard displayed in the Dashboards Classic app, and the other with the new dashboard displayed in the Dashboards app.
Look for tiles that didn't upgrade at all. In the new dashboard, a tile that wasn't upgraded is replaced with a message in a Markdown tile.
Look for tiles that were upgraded but without the original visualizations. You can edit them to select different visualizations.
For details on what to expect, review the above sections:
