Security Investigator
Latest Dynatrace
Dynatrace Security Investigator  is designed for threat hunting, incident solving, and root cause analysis and provides assisted functionalities and automations to speed up and support investigation resolution. It supports evidence-driven security use cases based on logs, metrics, and traces ingested into Grail.
Capabilities
- Visibility into your investigation history: You can easily track your path, navigate to previous steps and results, and get a comprehensive overview of the entire investigation with the query tree.
- Fast and seamless evidence management while preserving the investigation context: You can keep track of your relevant findings by attaching them to your investigation as evidence for later use.
- Structured and viable information from your log records:
- By viewing the details of a field or record, you can grasp a detailed view of the data in its original format, regardless of the content, without the need for horizontal scrolling.
- By enabling the multiline content view, you can view the stack traces with their line breaks in their original form, which helps you understand the data much faster.
- By enabling line wrapping, you can view longer log lines without horizontal scrolling.
- Precise extraction of fields from complex data and instant feedback on your patterns with DPL Architect: You can access DPL Architect directly from the query results to quickly extract fields, use preset patterns, and get instant feedback about their effectiveness and coverage, without the need to re-execute queries.
Prerequisites
-
Dynatrace version 1.288+
-
Set up log ingestion (ingests security data into Grail).
-
For a list of permissions required, go to Dynatrace Hub
 , select Security Investigator, and display Technical information.
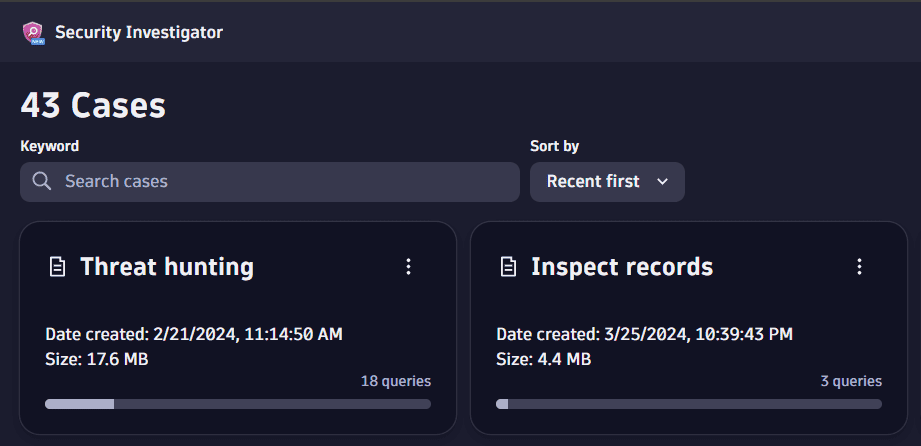
Get started
With Security Investigator, you can create an unlimited number of investigation scenarios. An example scenario is Threat hunting and forensics.
To create an investigation scenario, select  Case. Each scenario corresponds to a case. Once you create a case, you can build, rename, or delete it. You can switch between cases at any time. All your changes are automatically saved in the app.
To switch from one case to another, you have two options:
- Select Security Investigator in the upper-left corner. This takes you to the main menu, where you can select another case.
- Select
 next to the case name. This displays a panel with your recent cases from which you can choose.
Once you open a case, the following sections are displayed:
See below for details.
Timeframe selector
The timeframe selector section next to  Run defines the time filter you want to apply when running queries. When you open a case for the first time, the default timeframe (
Last 2 hours) is applied.
To change the default timeframe, you have the following options.
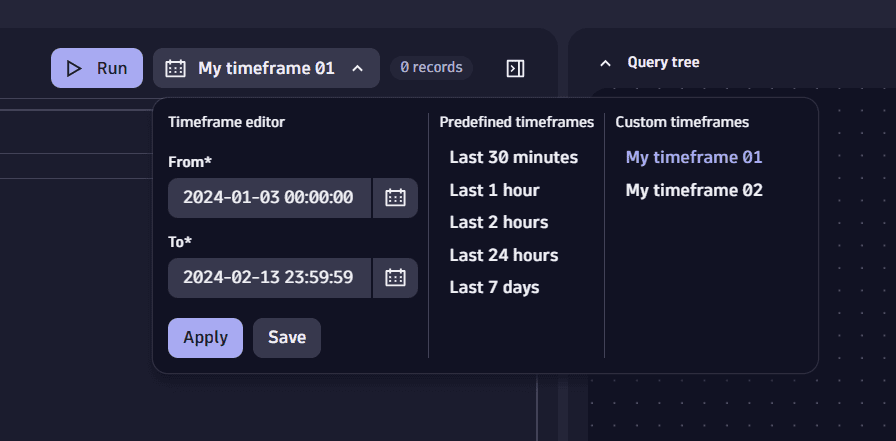
Timeframe editor
You can manually insert the dates. These dates aren't automatically saved for reuse.
In Timeframe editor, open the attached calendar  , select the timeframe (for example, from
 2004-01-03 to 2004-02-13), then select Apply.
Predefined timeframes
You can use any of the predefined filters suggested by Dynatrace.
In Predefined timeframes, select an option (for example, Last 7 days), then select Apply.
Custom timeframes
You can create and save timeframes that you can reuse within the same case.
-
To create a custom timeframe, you have two options:
-
Manually insert the values.
In Timeframe editor, open the attached calendar
, select a timeframe (for example, from 2004-01-03to2004-02-13), then select Save. Enter a name for your timeframe, then select Create. -
Select the values from the query results during your investigation.
In the query results, define the time range (use the Shift key to select multiple values in the timestamp), and then right-click and select Add to custom timeframes. This selects the
min()andmax()from the selected range and creates a new custom timeframe for your case.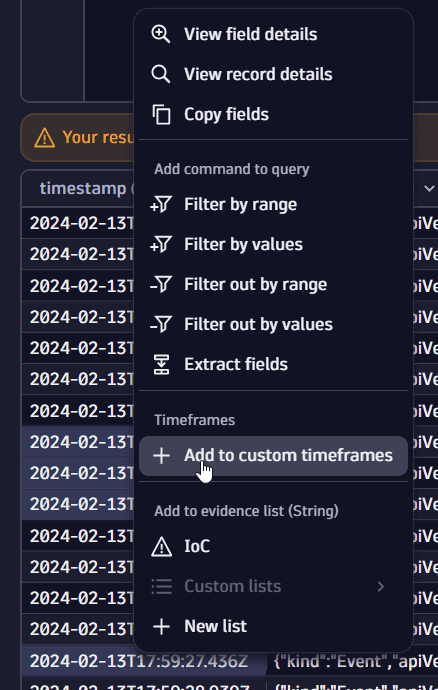
-
-
To use a custom timeframe, in Custom timeframes, select the desired timeframe, and then select Apply.
-
To rename or delete a custom timeframe, in Custom timeframes, select
 to the right of the desired timeframe, and then select
  Rename or
  Delete.
Using the fetch command with the timeframe or from parameter in the query input overrides your manual settings in the timeframe selector section.
Query input
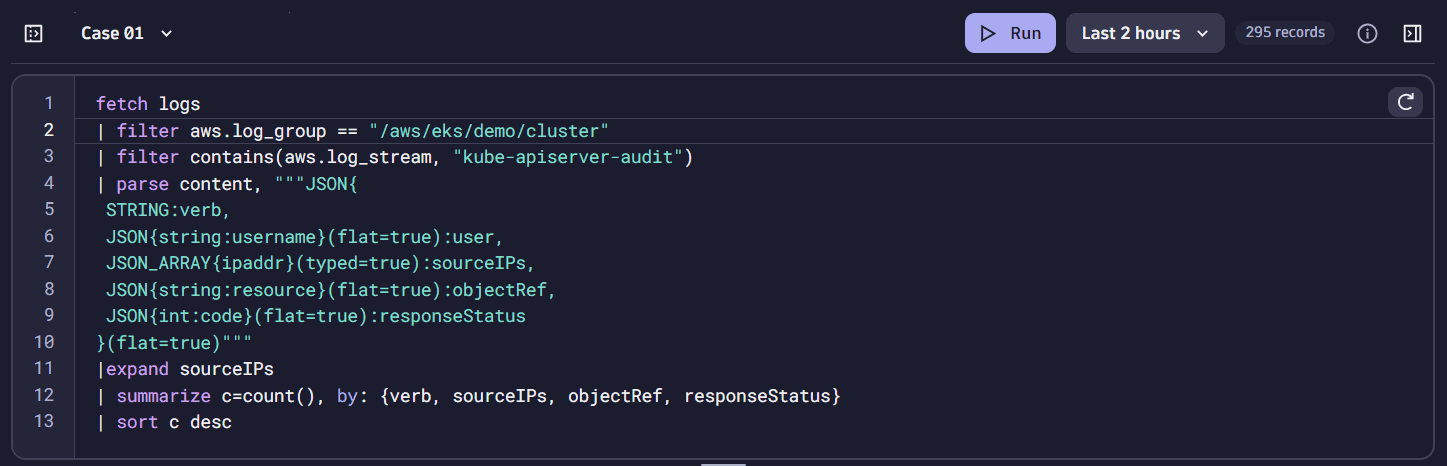
In the Query input section, you can define your Dynatrace Query Language (DQL) queries.
You can combine your DQL query with Dynatrace Pattern Language (DPL), for example by inserting preset patterns from DPL Architect. For instructions, see Extract.
To execute a query, select Run.
Once you execute a query, a query node is added to the query tree.
If you modify a query and are unhappy with the result, you can select  on the upper-right corner of the query input before executing it to revert it to the original query.
Query results
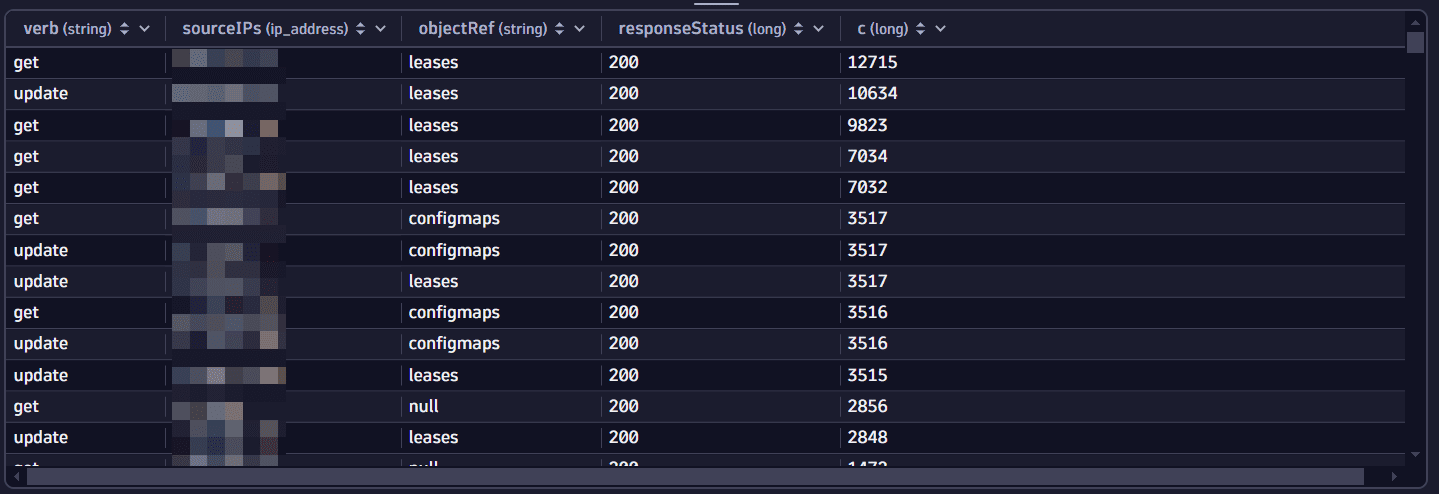
The Query results section
-
Returns the results of your queries in a table. The number of records is displayed to the right of the timeframe selector section. A maximum of 1,000 records are displayed.

-
Allows you to manipulate data and perform additional investigation tasks quickly.
See below for the tasks you can perform.
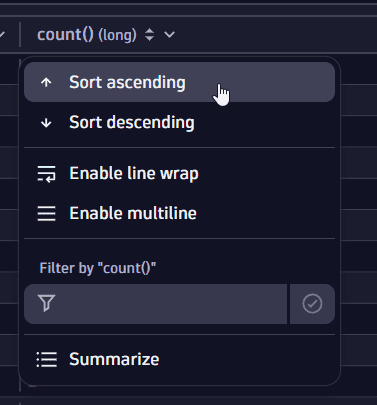
Sort 

Sorting allows you to control the order in which records are displayed. The default sort order is ascending. You can perform this action from the query results table menu without executing a query.
In the query results table menu, select the column header for the field you are interested in, then select Sort ascending ![]() or Sort descending
or Sort descending ![]() .
.
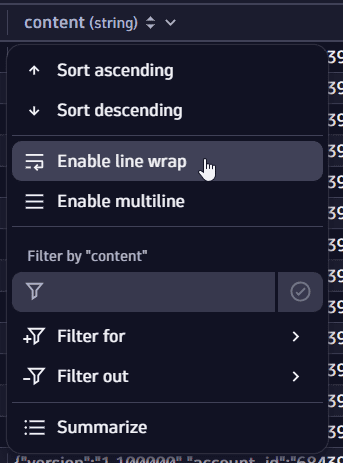
Enable line wrap 
Enabling line wrapping allows you to wrap lines that extend beyond the column width. You can perform this action from the query results table menu without executing a query.
In the query results table menu, select the column header for the field you are interested in, then select Enable line wrap. To reverse this action, select Disable line wrap.
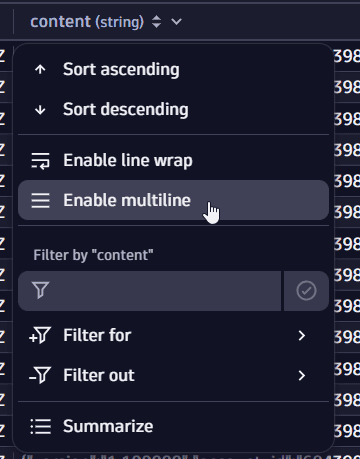
Enable multiline 
Enabling multiline allows you to view multiline logs in a column, respecting the line breaks in the log record. You can perform this action from the query results table without executing a query.
In the query results table menu, select the column header for the field you are interested in, then select ![]() Enable multiline. To reverse this action, select
Enable multiline. To reverse this action, select ![]() Disable multiline.
Disable multiline.
Summarize 
Summarizing adds a DQL snippet to the query that groups and aggregates records with the same value for a given field.
-
In the query results table menu, select the column header for the field you are interested in, then select
Summarize.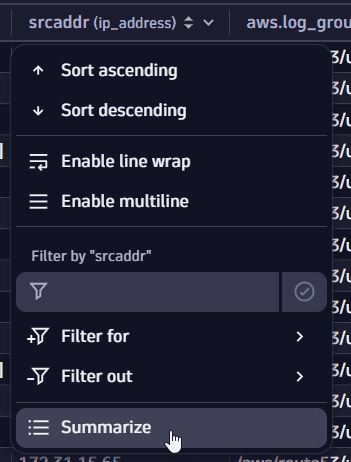
-
Selecting this option modifies the current query and adds the
summarizecommand to the query input. Select Run in the query input to execute the new query.
You can also summarize by a given field from the record details window. For details, see View record details.
Filter 
Filtering allows you to reduce the number of records in a list by keeping only the records that match the specified condition.
There are several ways to filter:
Filter by evidence
You can Filter for or Filter out by all the elements in your evidence collection.
-
In the query results table menu, select the column header for the field you are interested in, then select
 Filter for or
  Filter out > <Collection_name>.
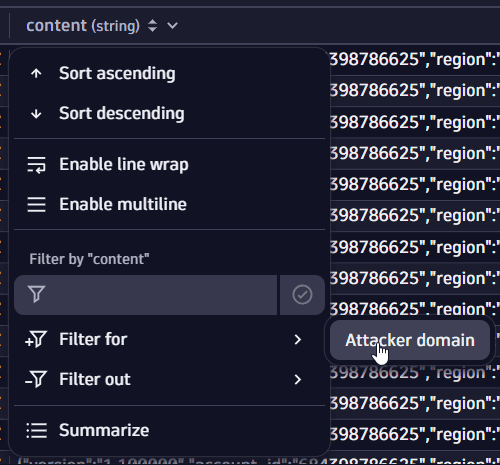
-
Selecting this option modifies the current query and adds the
filtercommand to the query input. Select Run in the query input to execute the new query.
Filter by field values
You can Filter for or Filter out by the partial or full value of a field, or by a sequence of fields.
-
Partial or full field value
-
In the query results table, select a partial or full value of a field, then right-click and select
Filter for or Filter out.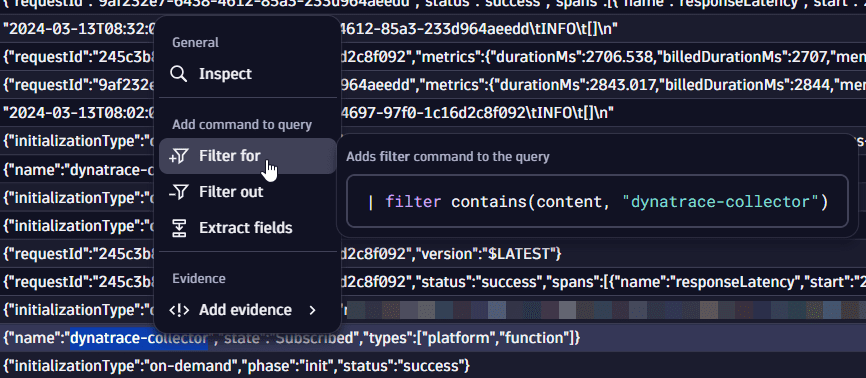
-
Selecting this option modifies the current query and adds the
filtercommand by the content of the selected cell to the query input. Select Run in the query input to execute the new query.
-
-
A sequence of fields
-
In the query results table, select a sequence of fields while pressing shift, then right-click and select
Filter for or Filter out.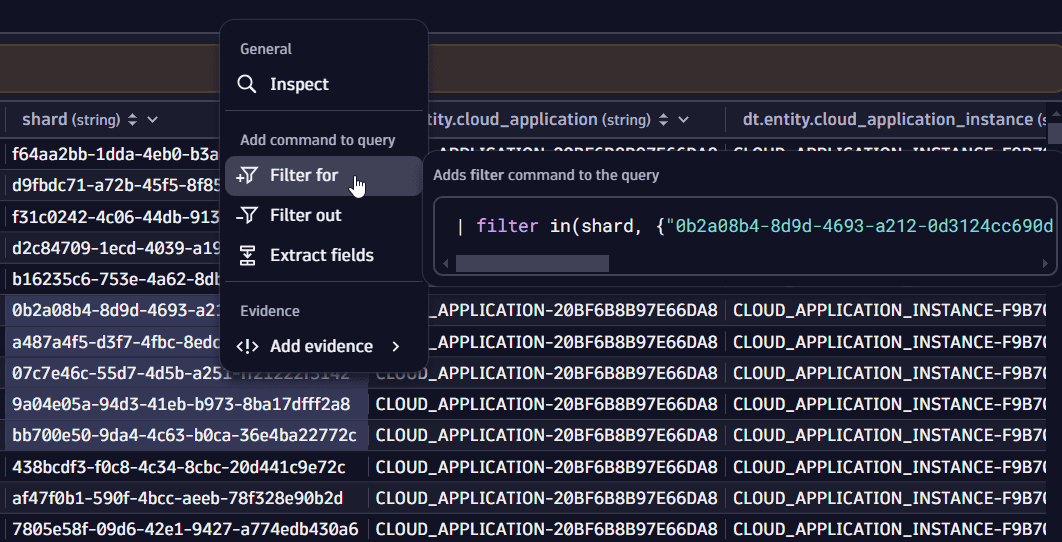
-
Selecting this option modifies the current query and adds the
filtercommand by the content of the selected cell to the query input. Select Run in the query input to execute the new query.
If you select a sequence of IPs, only the distinct values will be filtered for or filtered out.
-
Filter by timestamp
To filter your query by values of the timestamp field, you have the following options.
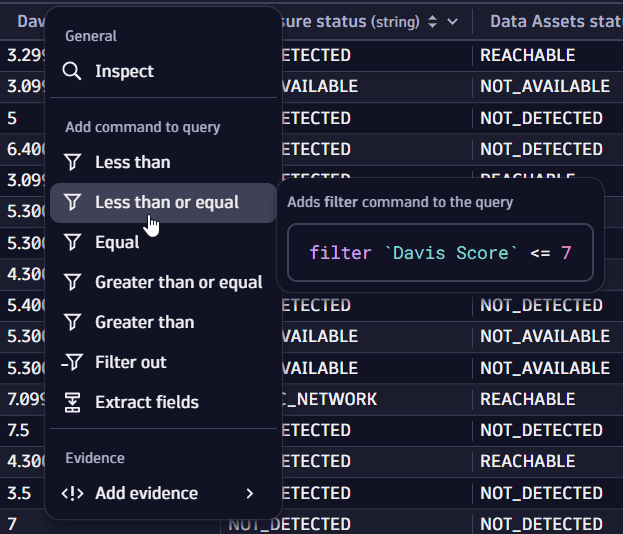
Filter by number operators
You can filter by number operators such as Less than, Less than or equal, Equal, Greater than or equal, and Greater than.
-
In the query results table, select a cell, then right-click and select one of the operators.
-
Selecting this option modifies the current query and adds the
filtercommand by a DQL operator to the query input. Select Run in the query input to execute the new query.
Free-form filter
You can manually define the filter condition for one or multiple fields at the same time and filter results with or without executing a query.
View details 
Viewing details
- Allows you to inspect the detailed content of a field or record
Shows the data in its original format, even if it contains non-printables like tabs, multiple spaces, or line breaks
Recognizes known formats as JSON and shows them in a structured format
Improves the readability and understanding of content
View field details
Example:
-
Data in a field:

-
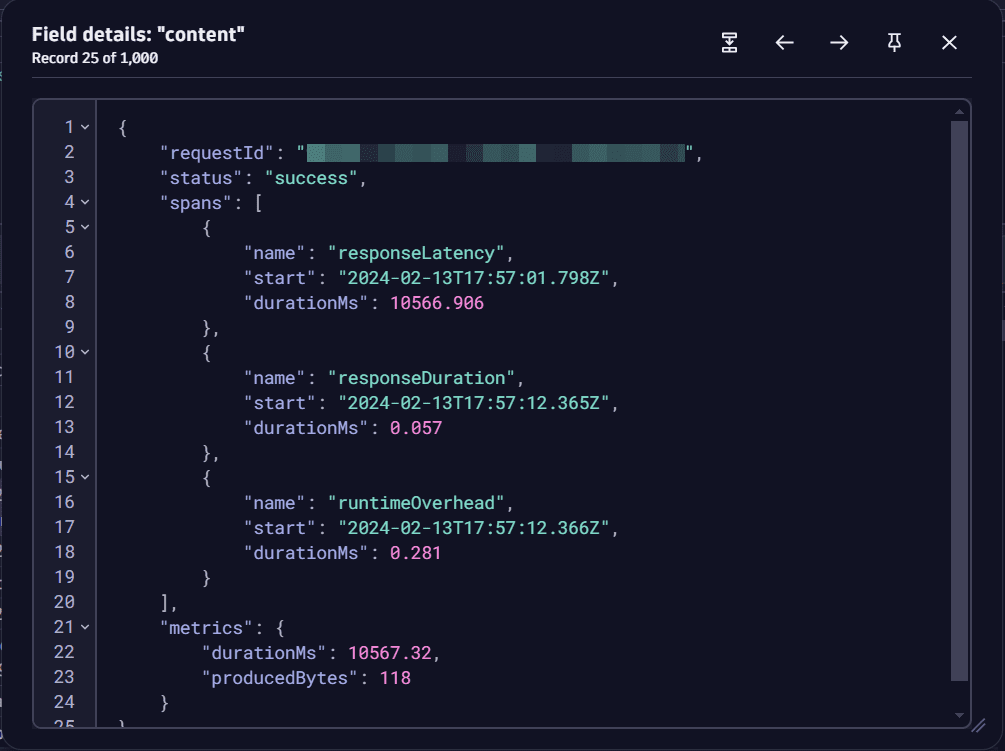
Data in a field upon viewing details:
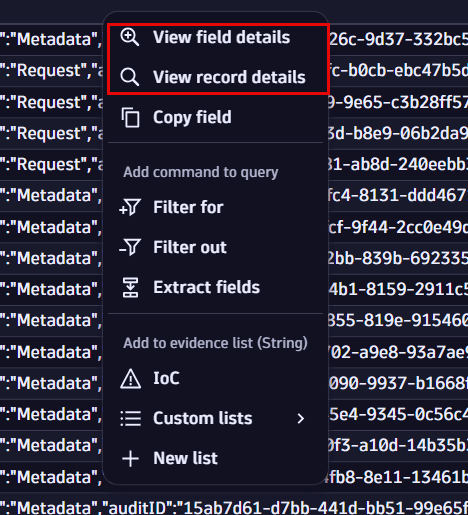
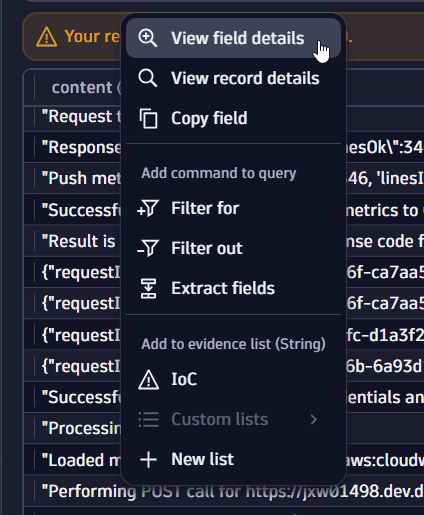
In the query results table, select a field, then right-click and select  View field details.
In the Field details (…) window you can perform the following actions:
-
Extract field with DPL Architect
Select
 in the upper-right of the field details window. This navigates you to DPL Architect for further investigations.
 -
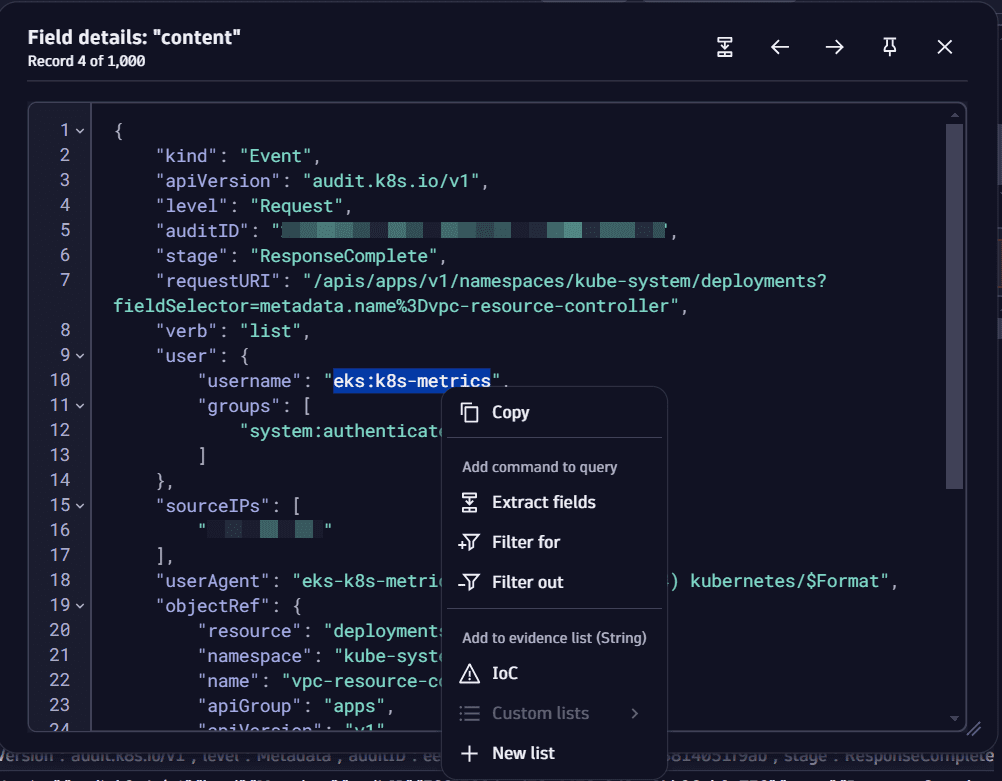
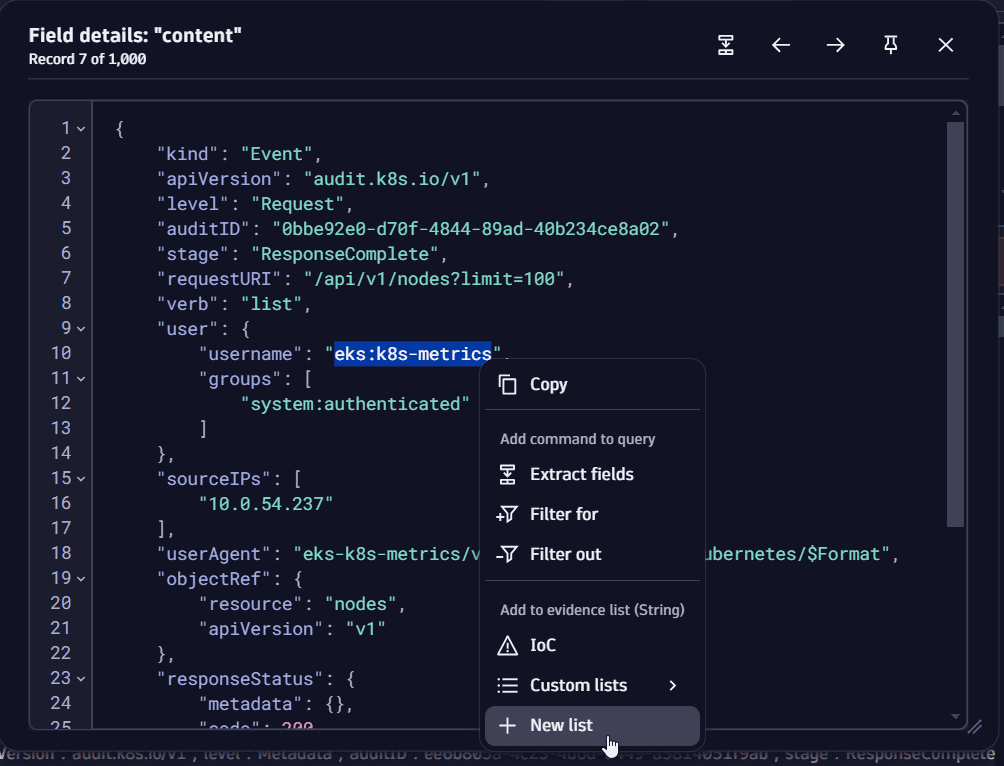
Copy, extract, filter for, filter out, or add selected field text to evidence collection
In the field details window, select the text you are interested in, then right-click and select the desired action.
 Copy: Copies the selected text to the clipboard for later reuse.
- Extract: Opens DPL Architect for investigations on the selected text.
- Filter for or Filter out: Adds the
filterorfilter outcommand to the query input based on your selected text. Select Run in the query input to execute the new query. - Add to evidence (string): Adds the selected text to the desired evidence collection.
-
Navigate up and down the records
Select
 or
or  in the upper-right of the field details window to navigate up or down the records.
 -
Pin and unpin the field details view
Select
 in the upper-right of the field details window. This collapses the window to the bottom-right corner of Security Investigator. Select again to unpin it.
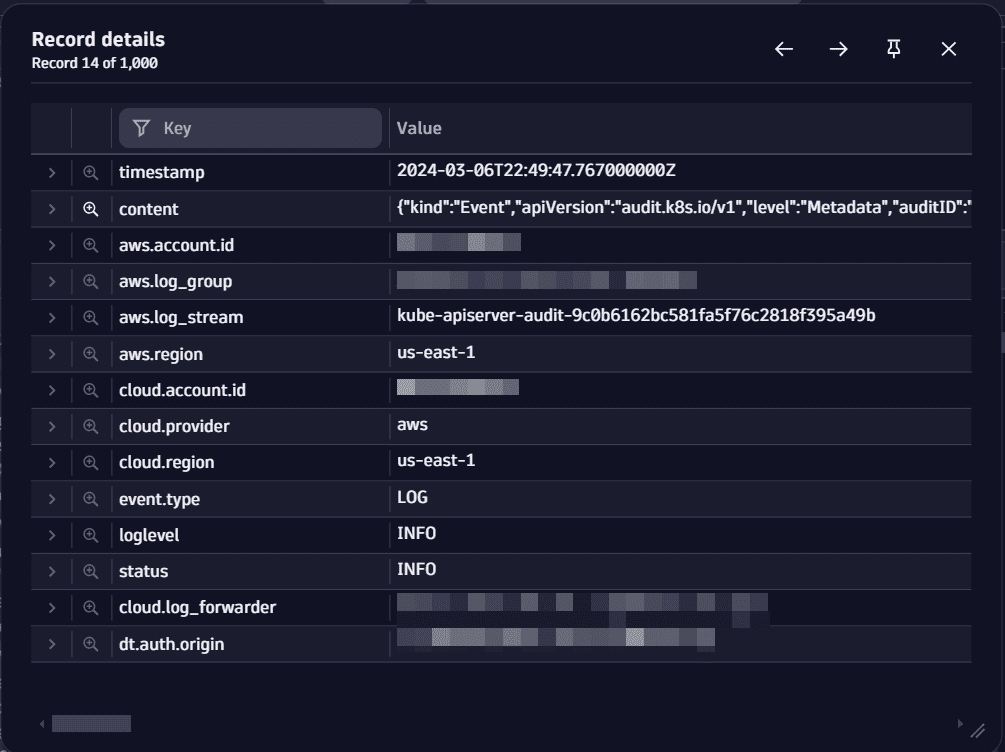
View record details
Example:
-
Data in a record:

-
Data in a record upon viewing details:
You have two options:
-
Option 1: Double-click on any record in the query results table.
-
Option 2: In the query results table, select a record, then right-click and select
View record details.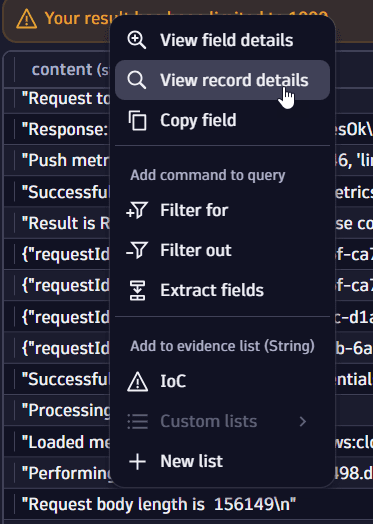
In the Record details window, you can perform the following actions:
-
Summarize by a given field (hover over a field, then right-click and select Summarize)
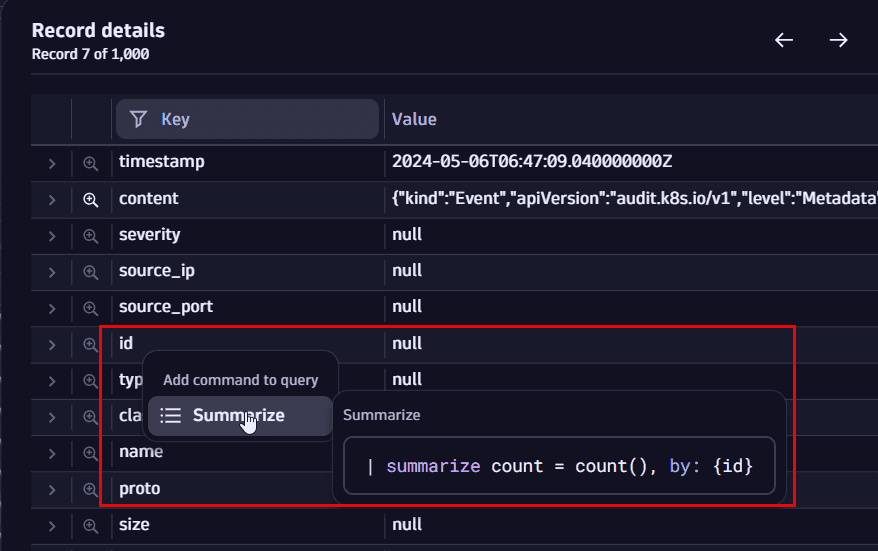
Selecting this option modifies the current query and adds the
summarizecommand to the query input. Select Run in the query input to execute the new query. -
Filter by field name (in Key, enter the full or partial field name)
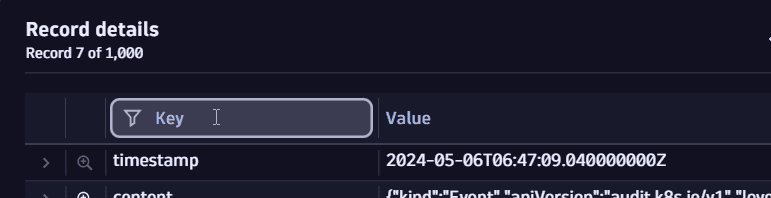
-
Expand a field to view subfields (select
 next to a field)
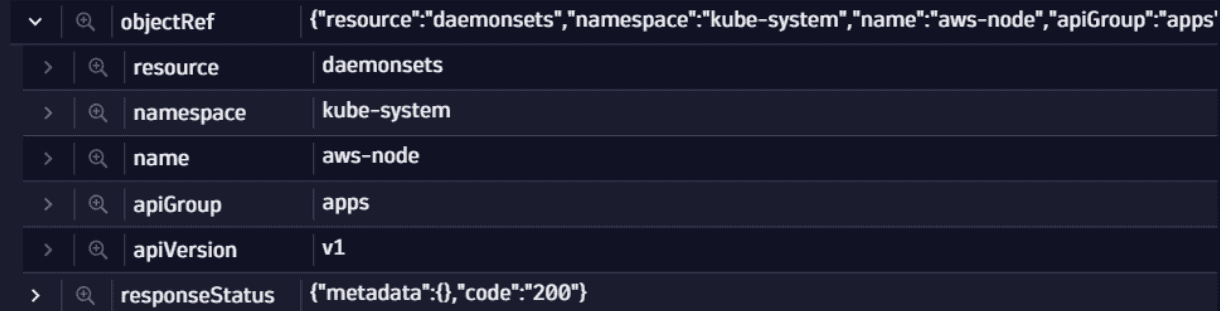
-
View a field's details (select
next to a field)Only fields with a content of over 500 characters can be inspected.
-
Filter based on full or partial field values (select the value, then select
Filter for).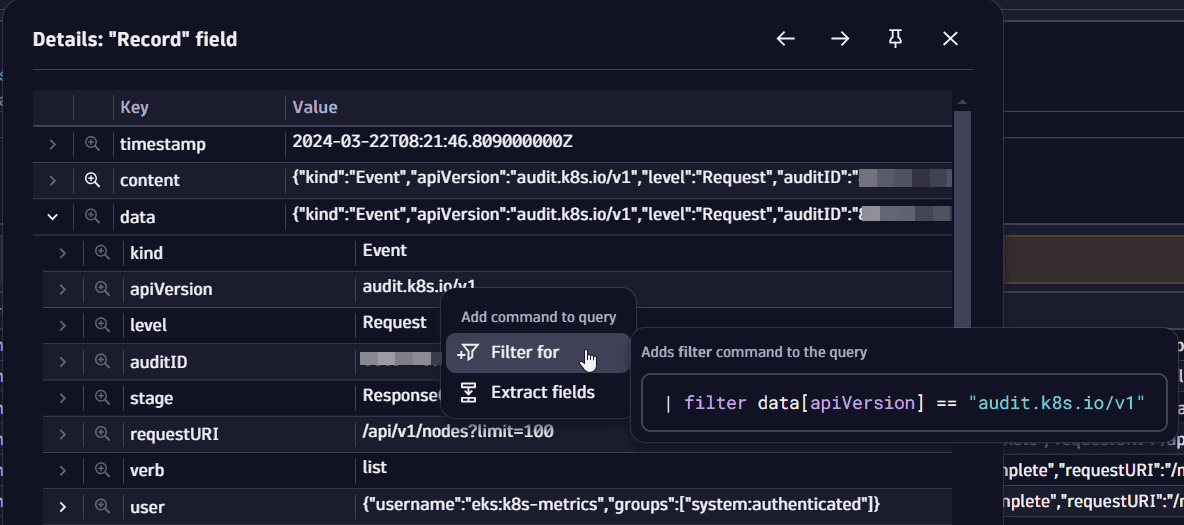
Selecting this option modifies the current query and adds the
filtercommand to the query input. Select Run in the query input to execute the new query. -
Extract fields (select a field, then select
Extract fields).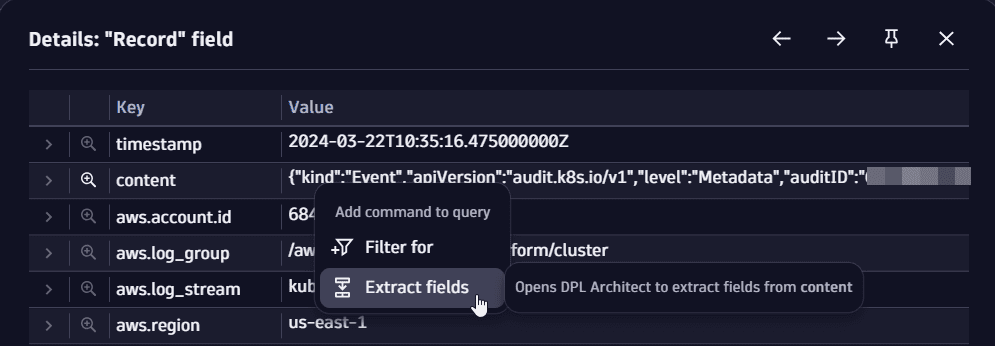
Selecting this option opens DPL Architect for further investigations.
-
Add a field to the query input (hover over a field, then right-click and select Add field).
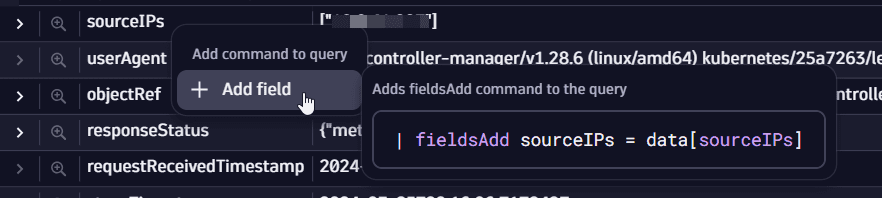
Selecting this option modifies the current query and adds the
fieldsAddcommand to the query input. Select Run in the query input to execute the new query.
Extract
Extracting fields allows you to open DPL Architect and continue your investigation from there.
There are several ways to open DPL Architect from the query results table.
-
Option 1: Select one or multiple fields, then right-click and select
Extract fields.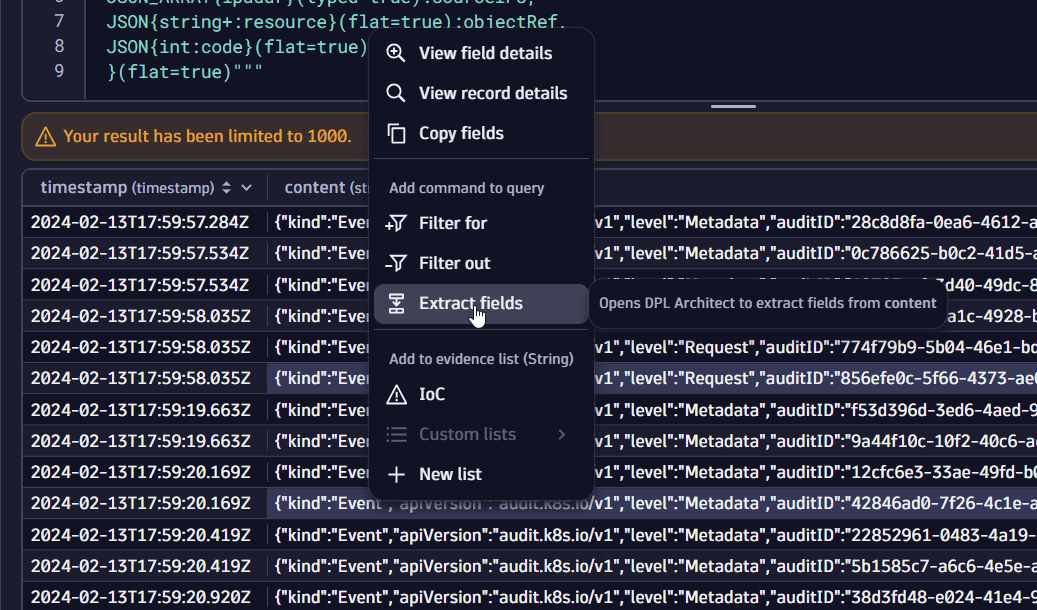
-
Option 2: In the Details (…) window that opens when you View field details you can
-
Extract a field (select
in the upper-right of the window)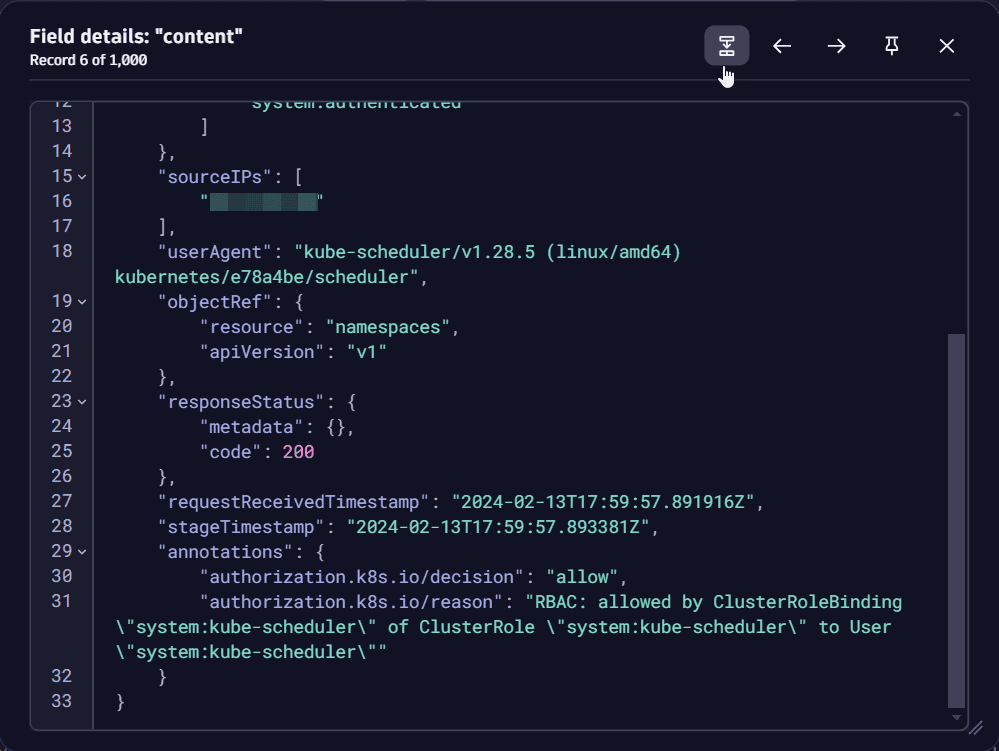
-
Extract selected text in a field (select the text you are interested in, then right-click and select
Extract fields)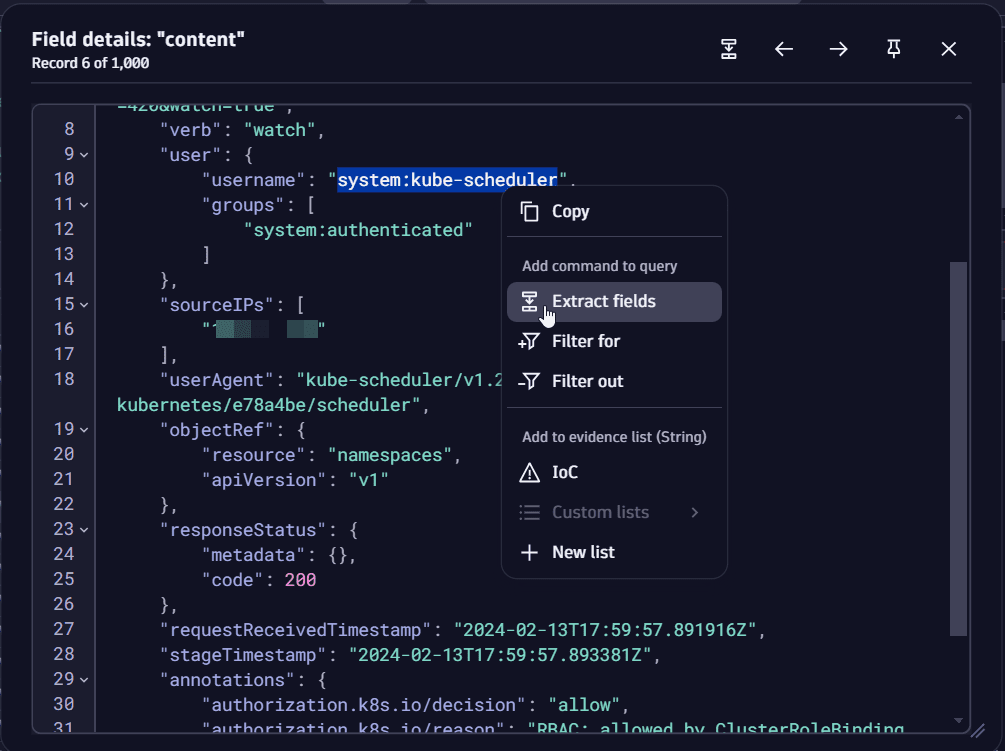
-
-
Option 3: In the Details (…) window that opens when you View record details, select a value, then select
Extract fields.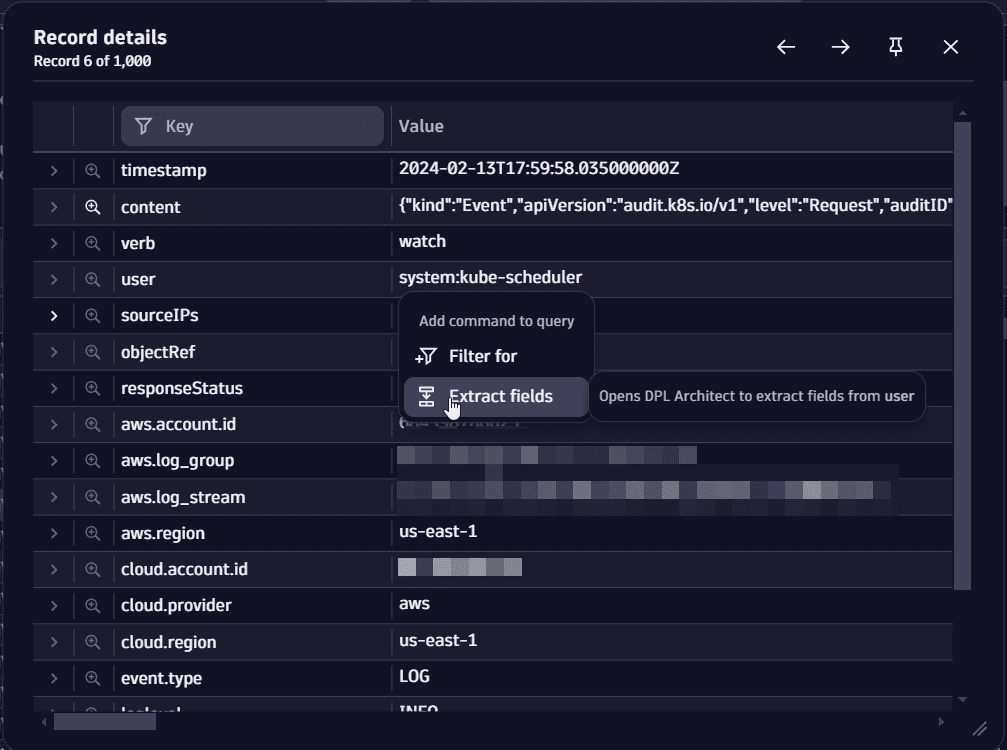
For more information on how you can use DPL Architect in your investigation, see
Add evidence 
You can add as evidence
-
Strings
There are two options.
-
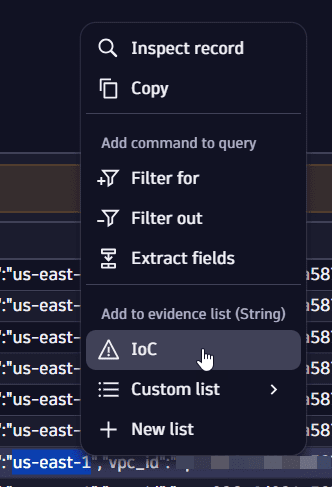
Option 1: In the query results table, select the string, then right-click and select one of the available options in the Add to evidence list (string) section:
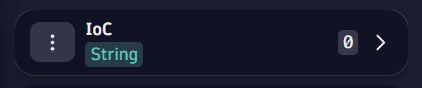
 IoC (adds the string to a default evidence collection)
- Custom lists > <Collection_name> (adds the string to an existing custom collection)
- New list (creates a new custom collection and adds the string to it)
-
Option 2: In the Field details (…) window that opens when you View field details, select the text you are interested in, then right-click and select one of the available options in the Add to evidence list (string) section.
-
-
IPs (one or multiple IP values)
-
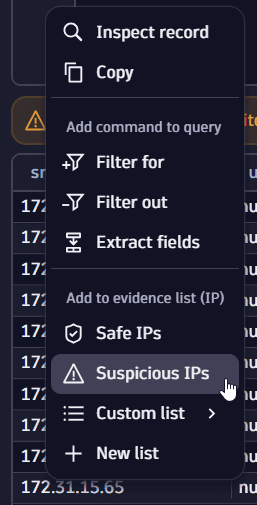
Select the desired IP (or, to select more IPs at once, select the desired IPs while pressing Crtl).
-
Right-click and select one of the available options in the Add to evidence list (IP) section:
 Safe IPs or Suspicious IPs (adds the IPs to a default evidence collection)
- Custom lists > <Collection_name> (adds the IPs to an existing custom collection)
- New list (creates a new custom collection and adds the IPs to it)
Besides IPv4 addresses, you can also add as evidence IPv6 addresses or subnet masks. Filtering by evidence containing a subnet mask displays all IPs within that subnet, which simplifies your queries.
-
There is no limitation on the number of collections you can create or of elements you can add to a collection.
After adding evidence, you can manage it in the Evidence collection section.
Copy
You can copy the partial or full value of a field or multiple fields to the clipboard and reuse this data in a different place.
-
To copy the partial value of a field, select a partial value, then right-click and select
Copy selection.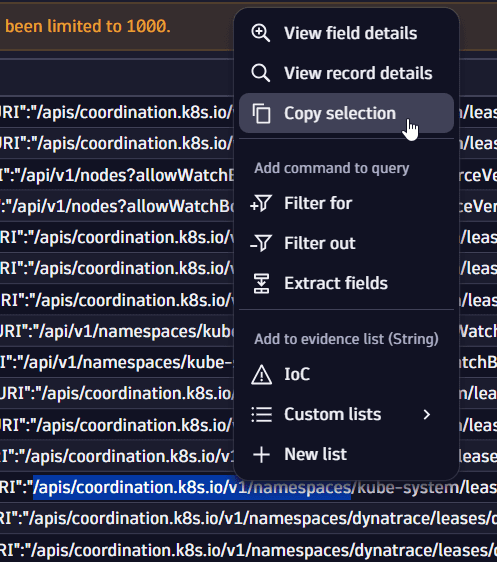
-
To copy one or more fields, select the desired fields, then right-click and select
Copy fields.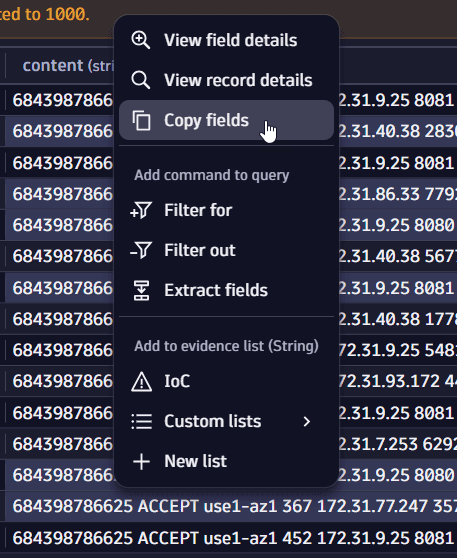
Query tree
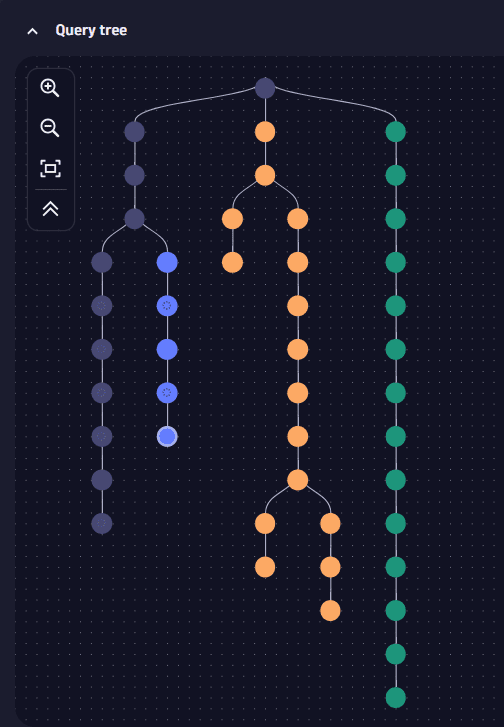
The query tree is a visual representation of your query history, designed to help you quickly
Navigate among queries
Verify results
Perform additional queries
Keep track of your investigation steps
A query tree is composed of
Root node: The initial node created in the query tree when you execute your first DQL query.
Query nodes: Each time you modify and execute a DQL query, a new query node is added to the tree.
Query branches: A string of query nodes forms a query branch. If you navigate to a previous query and then modify and execute it, a new query branch with a new query node is created from the respective query. Query branches are visual representations of your investigation paths.
Despite any modification in the query tree, the following elements are always preserved:
The integrity of the previously existing queries and results
The relations among queries
The context of the investigation
If you modify your query to a point where no further analysis is possible, you can navigate back in the tree to your last working query and continue your investigation from there. This creates a new branch in the query tree.
Query node states
Query node states are designed to help you
Understand the current state of your DQL query
Identify when something is wrong with the query
Remediate potential issues related to the query
Potential query node states are described below.
| State | Description |
|---|---|
| Query is executing. |
| Query returned new results. |
| Query returned no results. |
| Query was modified but not executed. |
| Query failed. |


Customize query nodes
For fast identification, you can
-
Rename query nodes
Select
to the right of the desired node, then select Rename. -
Color query nodes individually or in bulk
Select the desired nodes, then select Color in the
to the right of any of the selected nodes.Once you change the color of your last query node, all the subsequent query nodes automatically acquire that color, until you change it again.
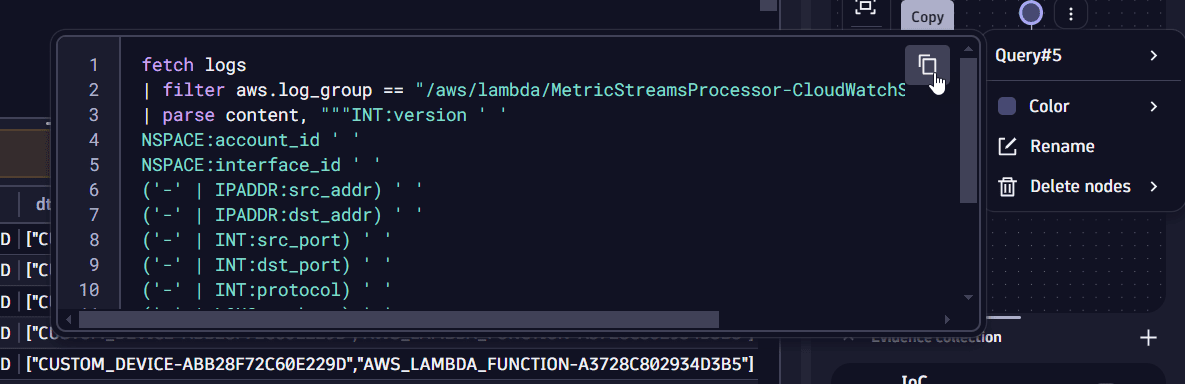
Preview and reuse queries
You can quickly preview and reuse queries straight from the query tree, without having to navigate to them. This saves you time and is more convenient.
- To preview a query, select to the right of the desired node, then hover over the node name.
- To reuse a query, select to the right of the desired node, then hover over the node name and select Copy .
Delete query tree parts
If you consider any part of your investigation to be irrelevant, you can clear it out of the tree. You can delete any of the following.
-
A node
Select
to the right of the desired node, then select Delete nodes > Only this node. -
A node and its descendants
Select
to the right of the desired node, then select Delete nodes > With descendants. -
A sequence of nodes
-
Press the
shiftkey while selecting the nodes you want to delete. -
Select
to the right of any of the selected nodes, then select Delete nodes > Selected nodes only.
-
-
All nodes except a sequence of nodes
-
Press the
shiftkey while selecting the nodes you want to delete. -
Select
to the right of any of the selected nodes, then select Keep selected branches.
-
Evidence collection
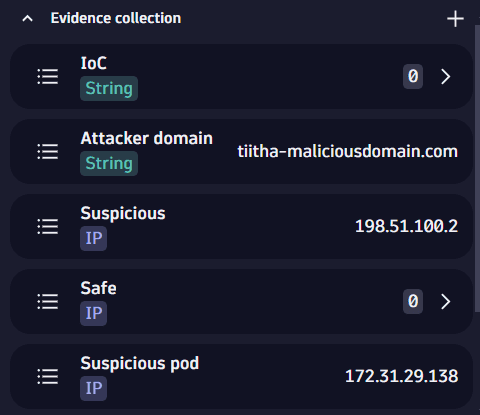
During your investigation, you can store the following elements as evidence for later use:
Strings (partial or full value of a field)
IP addresses
You can use evidence to search for particular elements in the logs and have an overview of the evidence found for later reporting.
To store elements as evidence, you can
-
Use preset collections:
-
IoC, for strings that are Indicators of Compromise.
-
Suspicious, for IP addresses that look suspicious.

-
Safe, for safe IP addresses.

-
-
Create and customize your own lists
For instructions, see Add evidence.
Use evidence
To search for evidence in the logs, you can filter or filter out a query by
-
A single element in a collection
-
Select
next to the desired element. If you have more than one element in the collection, you need to select to expand the collection first. -
Select
Filter for or Filter out, then select one of the available fields with the same data type.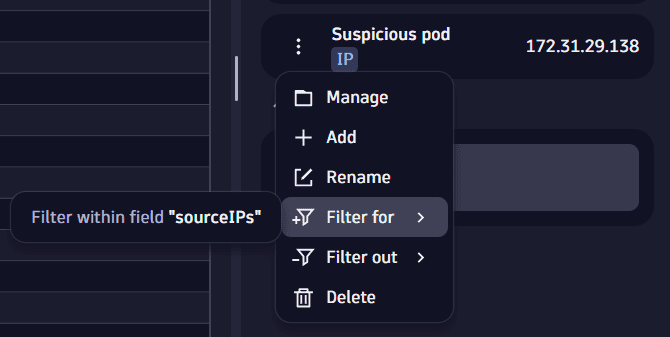
-
Selecting this option modifies the current query and adds the
filterorfilter outcommand to the query input. Select Run in the query input to execute the new query.
-
-
Multiple elements in a collection
-
Select
next to the desired collection. -
Select
 Manage.
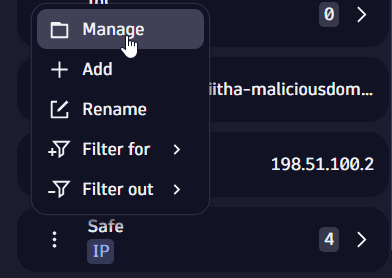
-
Select the desired IPs, select Filter, then select one of the available fields with the same data type.
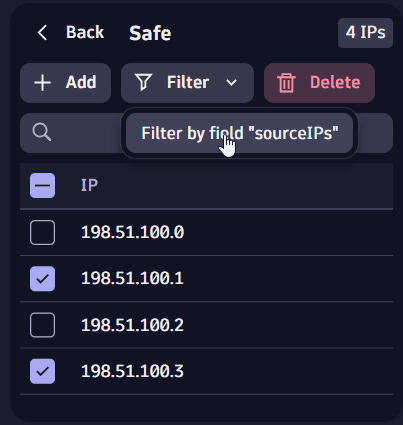
-
Selecting this option modifies the current query and adds the
filterorfilter outcommand to the query input. Select Run in the query input to execute the new query.
-
-
All elements in a collection
-
Select
next to the desired collection. -
Select
Filter for or Filter out, then select one of the available fields with the same data type.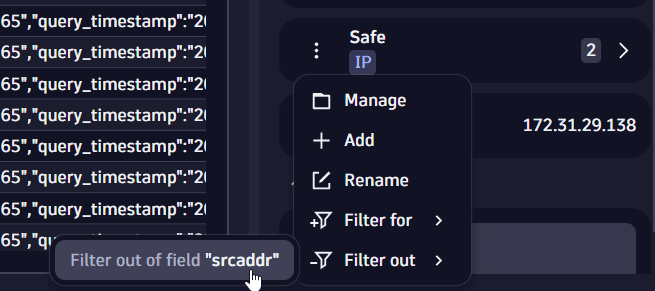
-
Selecting this option modifies the current query and adds the
filterorfilter outcommand to the query input. Select Run in the query input to execute the new query.
-
The options to filter for or filter out aren't available if the fields in the query results are not relevant or if the query returns no result.
You can also filter for and filter out evidence from the query results table. For details, see Filter.
Manage evidence
To manage evidence, you can perform the following operations.
Create a new collection
-
Select
next to Evidence collection.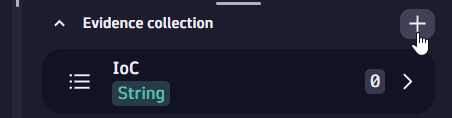
-
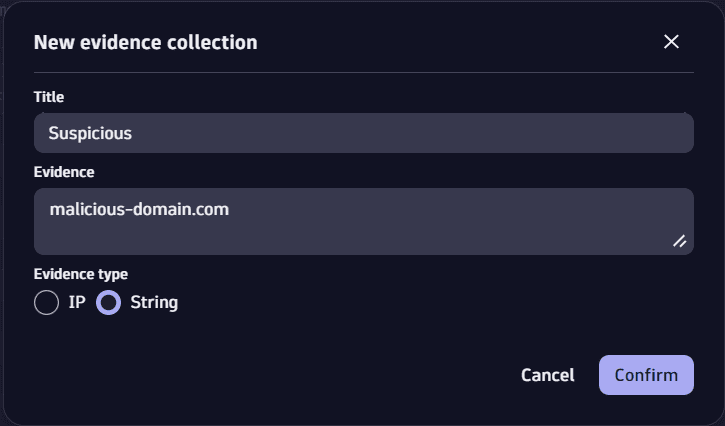
Enter a title for your new collection, enter the element, and select the evidence type (IP or String).
-
Select Confirm.
You can also create collections from the query results table. For details, see Add evidence.
Add elements to a collection
Option 1:
- Select next to the desired collection.
- Select Add data.
- Enter the new element, then select Confirm.
Option 2:
- Select next to the desired collection.
- Select Manage.
- Select Add data.
- Enter the new element, then select Confirm.
You can also add elements from the query results table. For details, see Add evidence.
Delete elements in a collection
-
Individually
-
To delete an element in a custom collection
- Select next to the desired element. If you have more than one element in a collection, you need to select to expand the collection first.
- Select Delete.
- Select
-
To delete an element in a preset collection
- Select next to the collection with the element you want to delete.
- Select Manage.
- Select the element you want to delete, then select Delete.
- Select
-
-
In bulk
- Select next to the collection with the elements you want to delete.
- Select Manage.
- Select the elements you want to delete, then select Delete.
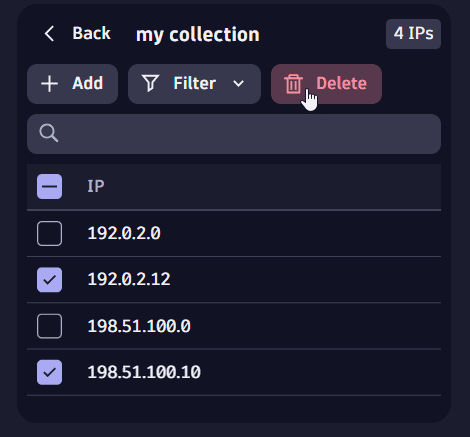
- Select
Delete a collection
- Select next to the desired collection.
- Select Delete.
Preset collections (IoC, Suspicious, Safe) cannot be deleted.
Notes
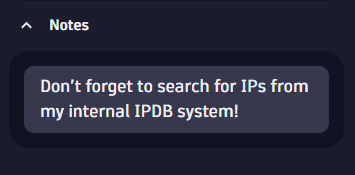
You can use the Notes section as a scratchpad for keeping a record of your activities for later use. For example, you can enter
Reminders: "Don’t forget to search for IPs from my internal IP DB system!"
Conclusions of your investigation: "Attacker came from one of the IP’s in my suspicious IP list."
After you enter a note, it's displayed on Security Investigator home page for the respective case. This can help you identify a case or remind you what you need to do.
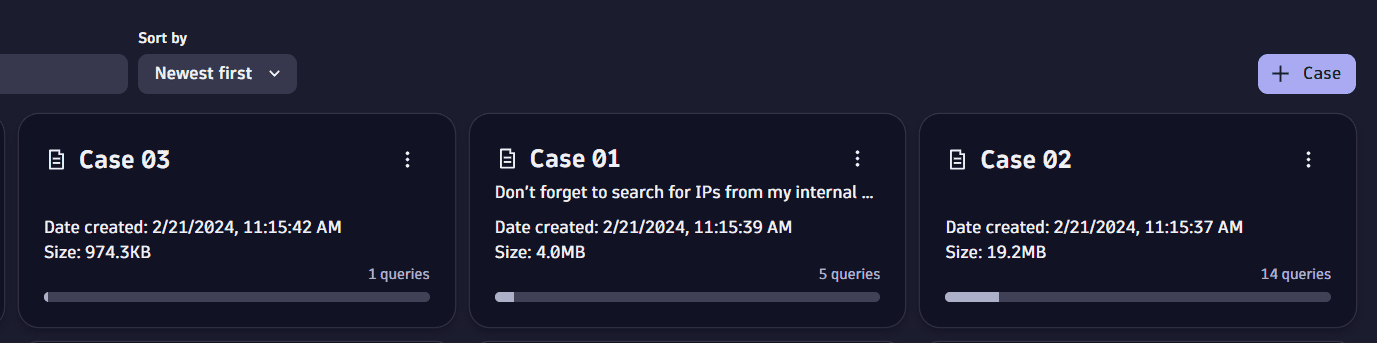
Limitations
You can create a maximum of 100 nodes per case.
The maximum size of a case is 1GB.
Go to the Security Investigator home page. Each case card contains information about the case size and number of queries.
Further resources
For additional insights into Dynatrace Security Investigator, see
-
Dynatrace University tutorial: